








On this page
Key takeaways
- The published decay rates disagree by a factor of three because they measure different things on different lists, and most of them cite each other.
- You can compute your own rate in an afternoon: sample records by age, look each one up again, count what changed per field, divide by months elapsed.
- On a data feed,
date_updatedtells you when each record was last crawled. That date is the start of the clock, and it also shows you which records the crawler can no longer reach.
What decays, and what does not
Most decay in a B2B record comes from one event: a person leaves a job. That single event changes three fields at once. The role title changes, the company changes, and the work email dies, because the mailbox belonged to the employer. So when a sales or recruiting product reads a record from last year, the parts most likely to be wrong are the parts tied to the job.
A personal email and a mobile number usually survive a job change. They belong to the person, not the employer, so a move from one company to another leaves them where they were. That is why they are worth storing separately from the work fields, with their own check dates.
Company fields run on a different clock. A rename, a merger or an acquisition changes the domain for everyone at the company on the same day. One event can take out the work email of every contact you hold there.
The identifier is what lets you measure any of this. If you looked a record up by a profile slug or a Forager person_id, you can look it up again by the same key and compare. Without a stable key, you cannot tell "changed" from "different person".
refresh on the most active profiles, written into the contract.
Why the quoted rates disagree
The pages on Google's first page for "B2B data decay" each give a rate. Read together, as of November 2026, they look like this.
| Page | Rate quoted | Where the page says the number comes from | Page date |
|---|---|---|---|
| Instantly, "How often does B2B contact data go stale?" | 15–20% a year, "modeled simply"; 2% a month as an "illustrative rate" | BLS median tenure: 3.9 years for all wage and salary workers, 3.5 years private sector, January 2024. The page notes that BLS does not publish a turnover rate from tenure data. | Jul 23, 2026 |
| Cleverly, "What is data decay?" | 2.1% a month, "roughly 22.5% annually"; a range of 22.5% to 70.3% a year; job titles 65.8% a year; email 3.6% a month | HubSpot's "Database decay" page for the 2.1%; Landbase for the 3.6% email figure; inboundlabs for "70.8% of B2B business contacts go through at least one data change within 12 months" | Jul 17, 2026 |
| HubSpot, "Database decay simulation" | 2.1% a month, 22.5% a year | "Marketing Sherpas research"; no date for that research on the page | Undated |
| Leadspace support, "The cost of data decay to your business" | 2.1% a month; 20–30% a year; job titles "as high as 50% change a year" | HubSpot's page for the 2.1%; business.com for the 20–30% | Undated |
Sources retrieved 2026-11-01; URLs in the facts file.
Three things stand out. First, the 2.1% figure on three of the four pages is the same number, passed from MarketingSherpa to HubSpot to everyone else. Nobody on page 1 measured it. Second, the 22.5% and the 70% are not rival estimates of one quantity. The 22.5% is 2.1% a month compounded. The 70% counts records with at least one changed field in a year, where a title edit counts the same as a dead mailbox. Third, the one page that shows its working, Instantly, says plainly that its 15–20% is a model on a tenure median, and that the 2% a month is an illustration.
None of these numbers describes your list. Your list has its own mix of industries, seniority and countries, and its own age. The only rate that applies to it is one you compute from it.
Measure it in four steps
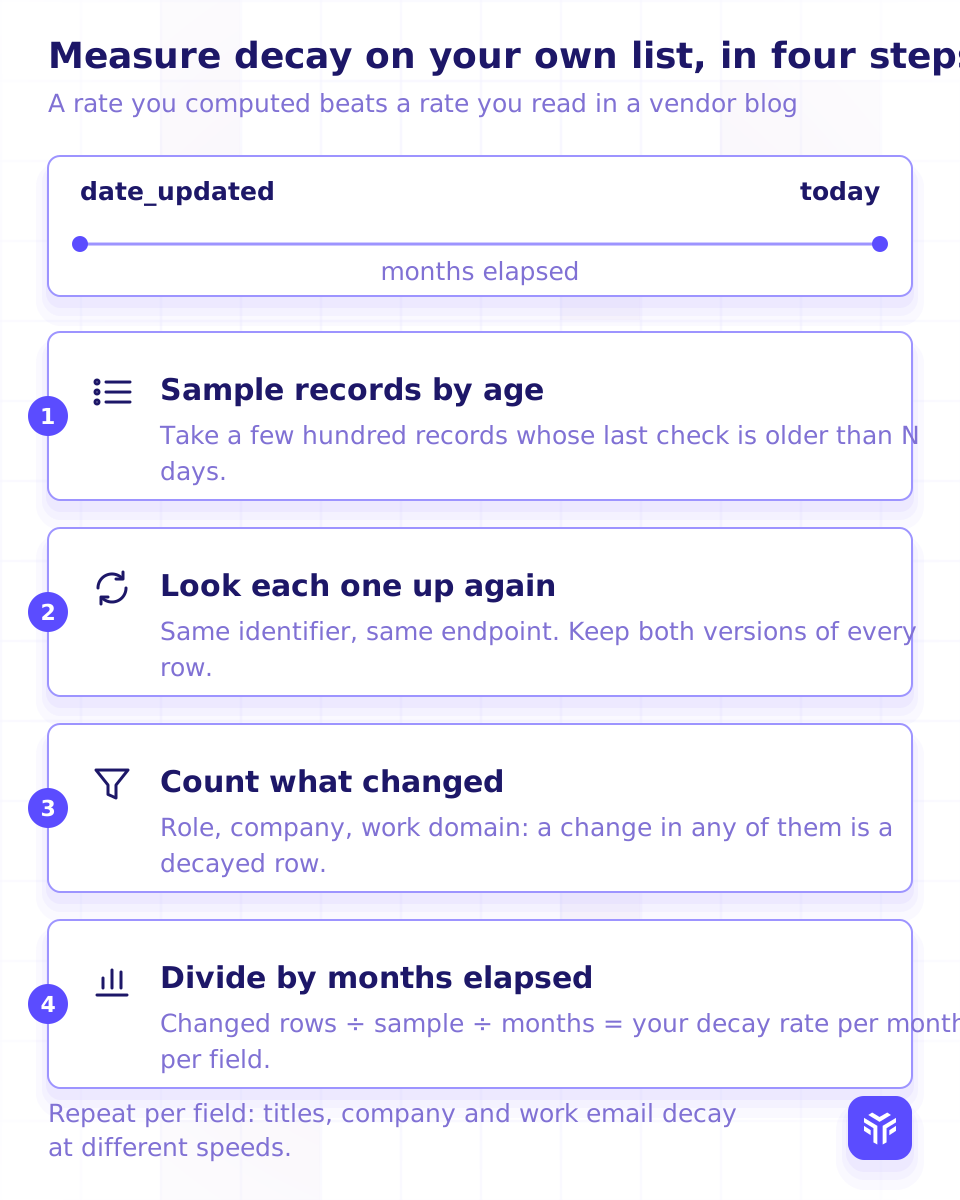
1. Sample records by age
Take a few hundred records whose last check is older than a set threshold. On a data feed the last check is the row's date_updated. For records you enriched through the API, it is the lookup date you stored when the result came back. If you did not store one, this is the first thing to fix, because without it there is no clock.
If you can, pull similar counts from three age bands, such as 3, 6 and 12 months old. Then you can see whether decay runs in a straight line or front-loads.
Keep the input exactly as you sent it. The comparison only works if every record is looked up by the same key both times.
2. Look each one up again
Same identifier, same endpoint. POST /api/{account_id}/datastorage/person_detail_lookup/ takes a person_id or a linkedin_public_identifier and returns the current record, including roles. It costs 1 credit per lookup, charged per request, so a 500-record sample is 500 credits.
Keep both versions of every row, the old and the new. You will want the pairs again next quarter.
Feed buyers do not need a second lookup. The next delivery carries the same records under the same id. Join the new drop to the old one and the comparison is a query.
3. Count what changed, per field
Decide what "changed" means before you look at a single row, and decide it per field:
- Role: the current
role_titlediffers. - Company: the current
organization_iddiffers. Compare the ID, not the name string, so a rename does not count as a move. - Work domain: the current
organization_domaindiffers. This is the field that predicts a dead work email. - Gone: the lookup returns nothing for a key that used to resolve.
Count changed rows for each definition separately. A record where the title changed but the company did not is a promotion, and the work email probably still lands.
4. Divide by months elapsed
For each field:
rate per month = changed rows ÷ sample size ÷ average months since last checkSay you re-looked-up 400 records that averaged six months since their last check, and 72 came back with a different organization_id. 72 ÷ 400 = 0.18, and 0.18 ÷ 6 = 0.03. Company changes at 3% a month on that slice of your list. Run the same arithmetic for role and work domain and you have three rates, not one.
Two cautions. A monthly rate from a six-month sample assumes a straight line; the 3-month band tells you whether that holds. And a few hundred rows is enough to tell 2% a month from 4%. It is not enough to tell 2.0% from 2.3%, so do not publish the second decimal.
Reading date_updated
Each row in a Forager feed file is one JSON object with four top-level fields: id, date_updated, schema_version and serialized_data. date_updated is when the record was last crawled, as a UTC timestamp. Inside serialized_data, each role object carries its own date_updated as well.
Two counts on a feed differ on purpose. The total record count is every person profile currently in the dataset. The "updated in the last month" count is how many of those profiles Forager was able to recrawl in that window. The gap between them is not an error. Forager stops crawling a profile when it becomes inactive, is banned on its network, or no longer exists, and a profile that is not crawled keeps its old date_updated.
That makes date_updated useful twice over. It is the start of the clock for the measurement above. It is also a flag: a record whose date_updated sits far behind the rest of the feed is one the crawler could not reach. Treat the distribution of that field across your whole feed as a freshness report you did not have to ask for.
Delivery cadence is not refresh cadence
A feed can be delivered daily, weekly or monthly. That schedule controls how often recrawled records reach your bucket or your Snowflake account. It does not control how often the underlying records are recrawled. Forager's docs put it in one line: delivery schedules "control how often the recrawled profiles are delivered to you, not how often the underlying data is refreshed."
Transfers can also be limited to records crawled since the last scheduled transfer, net new only. Ask support whether your feed delivers every record or only the records crawled since the last transfer. The mode changes how you read a drop. In net-new mode, a record missing from this week's file was not recrawled this week. It is not evidence that the record is unchanged.
So when a vendor tells you a feed is "weekly", ask the second question: weekly delivery of what? The honest answer names a delivery schedule and a recrawl pattern separately. For Forager feeds the delivery options are daily, weekly or monthly, records are recrawled on a rolling basis, and the refresh terms are written into the agreement.
What to do with your number
Set a re-check interval per field, not per list. If company changes at 3% a month on your list and you can live with one record in ten being stale, re-check company every three months. If work domain moves faster, re-check it sooner. The arithmetic is tolerance divided by rate.
Let a role change trigger the expensive lookups. When the re-lookup shows a new organization_id, that is the moment to run a fresh work email lookup for that person. A personal email or a mobile usually does not need one, because the job change did not touch them.
If you buy a feed, the re-check is the next drop. Join on id, diff the fields you care about, and the four steps above become a scheduled query. Keep each pair of versions and the diffs become a time series.
Write down where the number came from: sample size, age bands, date, definitions of "changed". That is what the page-1 articles are missing, and it is what makes your number worth quoting to your own users.
FAQ
How fast does B2B data decay?
The published figures run from about 2% a month to over 70% a year, and they measure different things: some count dead emails, some count any changed field. The rate for your list is the one you compute from a sample of your own records, per field.
Which fields decay fastest?
Fields tied to the job: role title, company and the work email at that company. A job change moves all three at once. A personal email and a mobile number usually survive a job change because they belong to the person.
How often should a list be refreshed?
Per field, at an interval set by the rate you measured and the staleness you can tolerate. A company change should trigger a new work email lookup. The fields that survive job changes can be re-checked less often.
What does date_updated mean on a Forager feed?
When the record was last crawled. Each feed row carries it at the top level, and each role object carries its own. Profiles that become inactive, are banned or no longer exist stop being crawled, so their date_updated stops moving.
Is delivery cadence the same as refresh cadence?
No. Daily, weekly or monthly delivery sets when recrawled records reach you. It does not set how often records are recrawled. Transfers can also be limited to records crawled since the last transfer, so a record missing from a drop is not proof that it is unchanged.
Run the four steps on your own records
Sample from your list, look each record up again on a free API key, and keep the pairs. Or send us a sample of your feed records and we will walk through the date_updated distribution with you on a call.
- Get $5 in free credits
- No credit card to sign up
#1 of 10 in Clay's 2026 test of mobile data providers Source: Clay